Share Analytics User Guide
Prodify Analytics Dashboard
Written By El
Last updated 10 months ago
General Overview
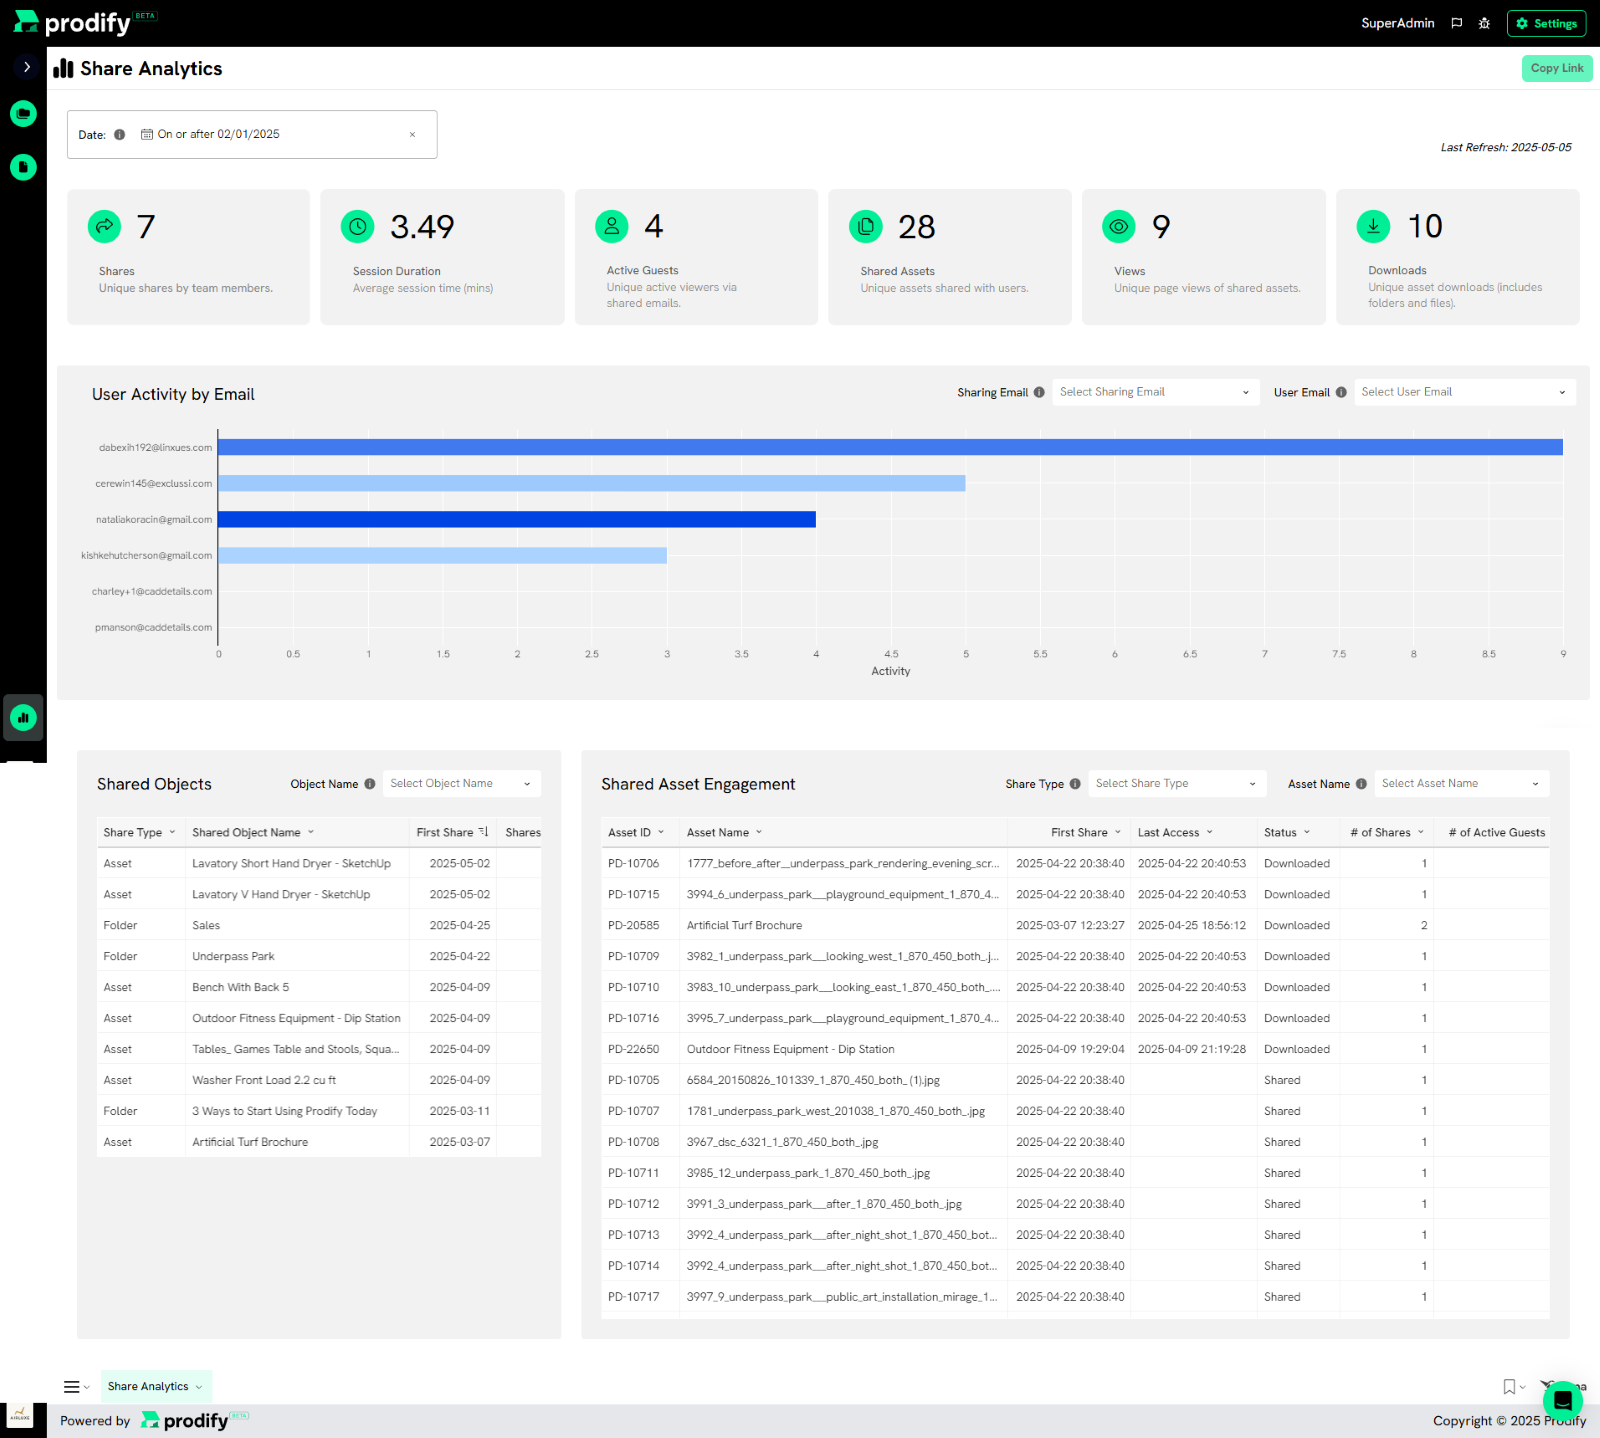
The Share Analytics dashboard in Prodify provides comprehensive analytics on user engagement with shared content. The dashboard refreshes daily at midnight Eastern time, ensuring up-to-date information for decision-making.
Please note the Share Analytics dashboard will not display any data until content has been shared.
This guide covers:
Key KPIs
Filter functionalities
Tables and visualizations
Exporting and scheduling features
Use Cases and Benefits
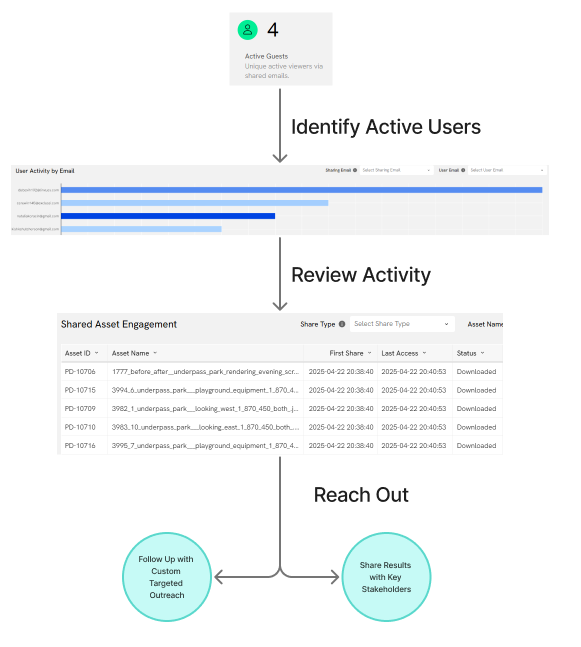
This dashboard provides quick visibility into user engagement to:
Identify high-engagement users for follow-up
Spot non-engaging users for re-engagement efforts
Monitor team-wide sharing performance
Share actionable data with stakeholders
Dashboard Overview
Key Performance Indicators (KPIs)

These cumulative KPIs reflect data share activity and engagement based on the applied filters:
Shares: Unique objects shared per target recipient email
Session Duration: Average session duration (in minutes) per engagement
Active Guests: Unique emails that have engaged with shared content
Shared Assets: Total number of unique assets shared
Unique Views: Page-level views of shared assets
Unique Downloads: Number of unique asset downloads (at folder or asset level)
Filter Options
The dashboard supports multiple filters to refine data views; each filter is applied to all elements on the dashboard:
Date Filter: Based on the date an object was shared (not when it was engaged with)
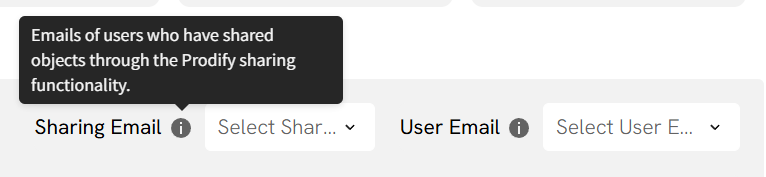
Sharing Email Filter: Filters by the email address that shared the content
User Email Filter: Filters by the email address of the user with whom content was shared
Shared Object: Filters by the object that was shared with recipient emails. This can be a folder or specific asset.
Share Type: Filters the objects which were shared based on if they are folders or specific assets.
Asset Name: Filters all the data based on the specific asset name which was selected.
Note: if shared assets have the same name, their engagement will be separated into multiple rows in the “Shared Asset Engagement” table distinguished by the Asset ID column.
Each filter includes an information icon explaining its function.
User Activity by Email (Bar Chart)
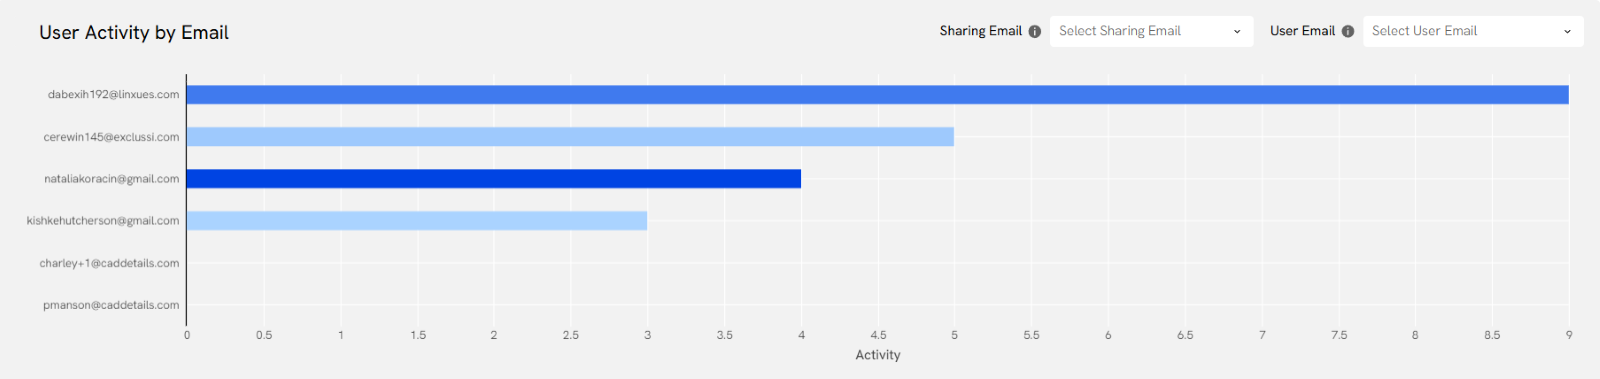
This bar chart displays which users have engaged most with shared content and how recently.
Deeper color = More recent engagement
Size of bar = Total activity of user. This activity count includes all engagement with shared content including OTP requests and folder/asset views and downloads.
Clicking a bar filters the dashboard to that user's activity
Clicking again, on blank space within the chart, resets the filter
Shared Objects Table
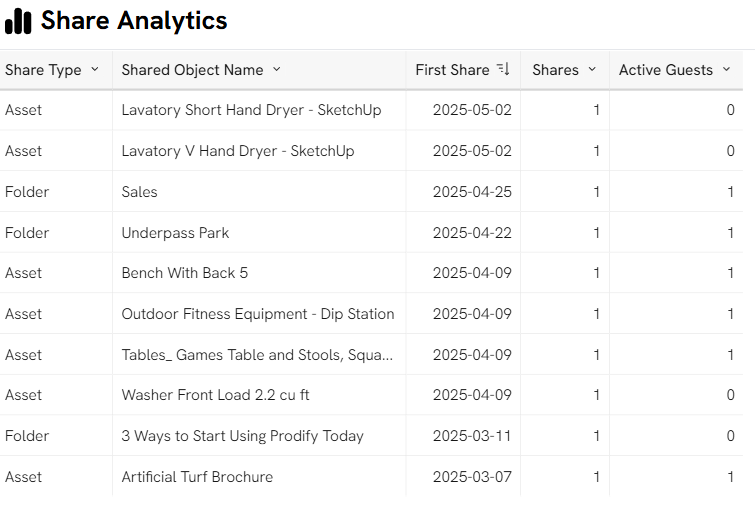
This table summarizes all distinct shared objects (folders or individual assets). Columns include the following and adjust based on filter settings:
Share Type (Folder/Asset): How the content (assets) was shared. Assets can be shared with users by sharing the 'Folder' object containing the asset(s) or by sharing the 'Asset' object specifically.
Shared Object Name: Name of the object (Folder or Asset) which was shared with users.
First Shared Date: Timestamp showing when a specific asset was first shared with users.
Total Unique Shares: Number of times a specific object (Folder or Asset) was shared with users.
Number of Active Guests: Number of unique users (emails) who have accessed this shared object.
You may quickly filter down to specific share types and/or shared objects in the table by clicking on a value in the ‘Share Type’ and/or ‘Object Name’ columns. To clear the selection, click on the ‘x’ button on the ‘Share Type’ and/or ‘Object Name’ filters, or select ‘reset’ on the bottom right of the dashboard.
Shared Asset Engagement Table
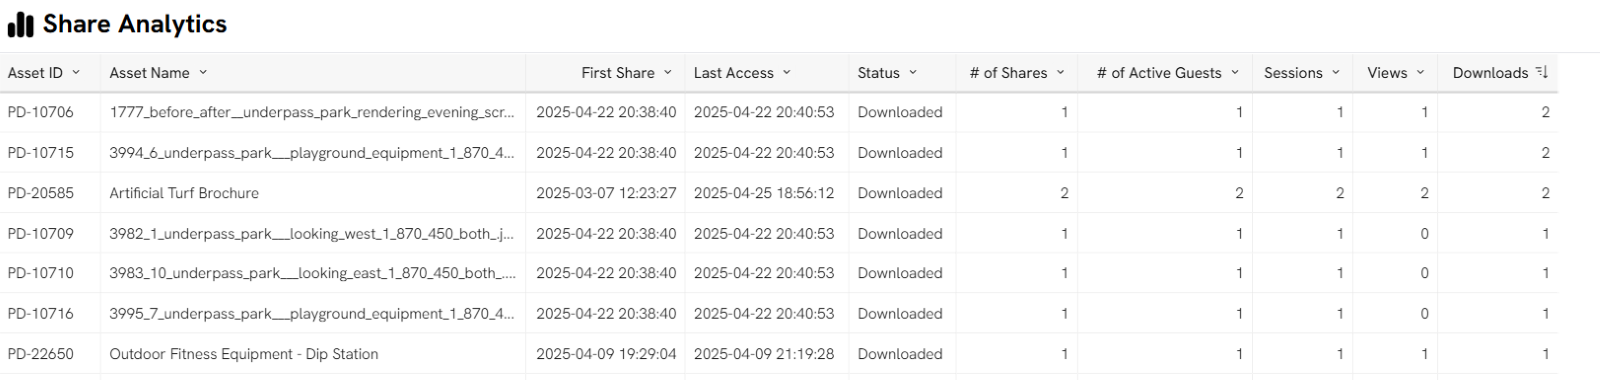
This table shows engagement per asset and all columns are adjust with filter settings:
Asset name: Current name of each asset as seen in Prodify.
First Share: Timestamp showing when a specific asset was first shared with users.
Last Access: Timestamp showing when a specific asset was last accessed by users with whom the asset was shared.
Status: The most important activity for each asset. Status ranges from Shared to Requested Access to Viewed to Downloaded (least to most important).
Number of shares: Number of times this asset was shared with users.
Number of Active guests: Number of distinct users (emails) who have accessed this asset during the time frame.
Number of Sessions: Number of distinct sessions where this asset was accessed during the period.
Number of Views: Number of distinct events where this asset was viewed during the period.
Number of Downloads: Number of distinct actions that resulted in the download of the asset.
You may quickly filter down to a single asset by clicking on a value for Asset Name in the table. To clear the selection, click on the ‘x’ button on the Asset Name filter, or select ‘reset’ on the bottom right of the dashboard.
Custom Views and Dashboard Sharing
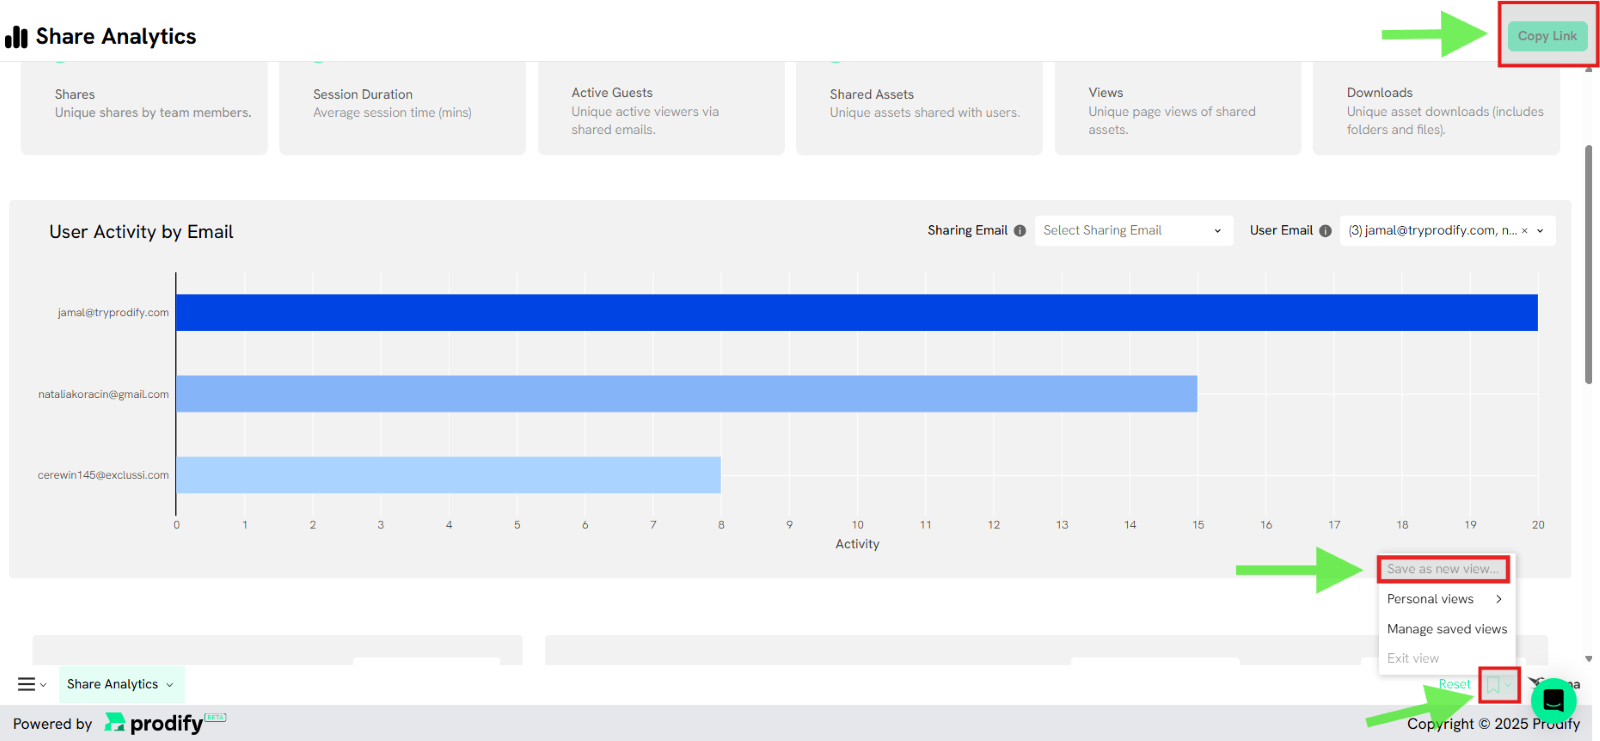
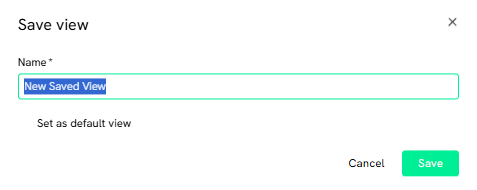
You can create and save custom filter views, naming them (e.g., New Saved View), and optionally set them as the default view. Custom views can be marked as default, edited, deleted, and leveraged in scheduled exports.
Also available:
Reset button to clear filters and revert to default view
Copy dashboard URL with filters pre-applied to share with teammate
Exporting and Scheduling Data
Export Options
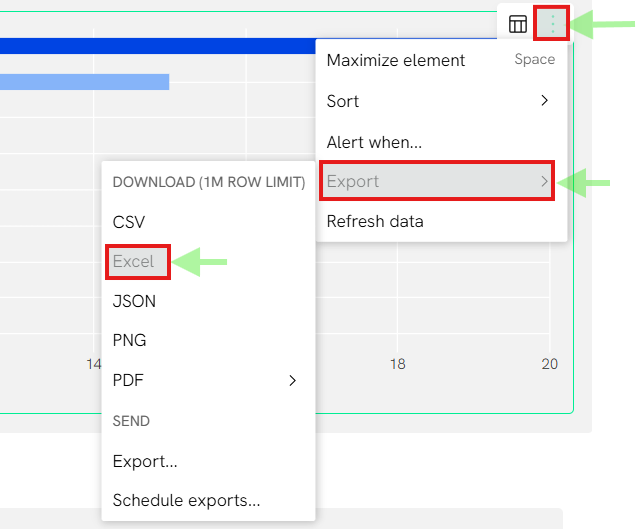
You can export any visual/table in multiple formats:
Excel, CSV, JSON, PNG, PDF
Export entire dashboard or individual elements
Schedule automatic exports
Scheduling Exports
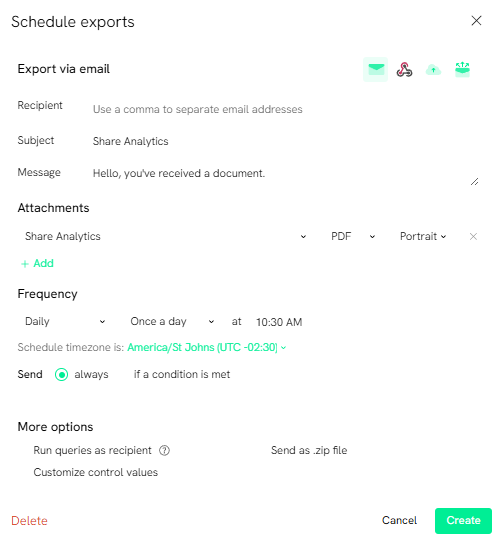
You can:
Email exports
Use Webhooks or cloud storage options
Set filters (custom controls) and conditions (e.g., “Active Guests > 1”)
Daily, monthly, or custom “cron” formulas can be used to schedule exports
Select one of your custom views to quickly define the filter settings for your scheduled export.
You can also:
Name export schedules
Create, edit, or delete multiple schedules